Attosecond physics simulation
A failed grad project that taught me alot
Attosecond physics, a field now thrust into the spotlight by Nobel laureates, promises to unveil the intricate electron dynamics within matter using ultrashort lasers. Let’s journey back to Fall 2021, when I, a wide-eyed graduate student, had just embarked on my academic path, moved continents, and was about to confront the unexpected challenges and marvels that awaited me. By the way, the thumbnail for this post was generated by AI, so I guess our jobs are safe for now.
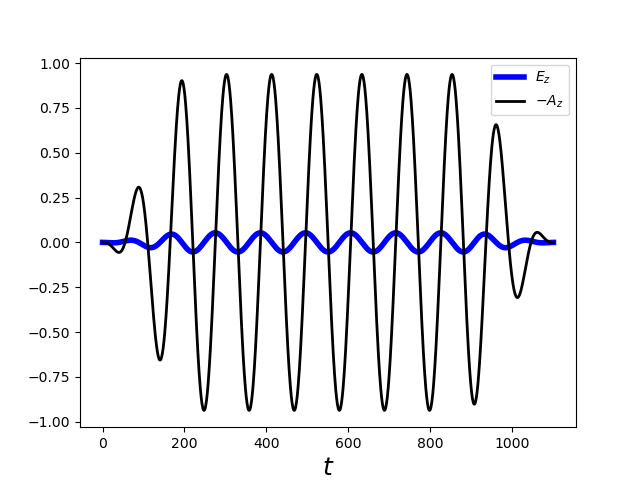
The strong field laser is given by the following expression: \(E_{z}(t) = E_0 \sin(\omega t) \sin^2(\frac{\omega t}{2N_c})\) where \(E_0\) is the peak field strength, \(\omega=2\pi/T\) is the laser frequency, and \(\tau\) is the pulse duration. The laser is turned on for \(0 < t < N_{c}\cdot T\). We will consider linearly polarized light, so the electric field is in the \(z\) direction. \(N_c\) is the number of cycles in the pulse. The wavelength of the laser in these experiments is usually \(~725 \rm nm\) in infrared region.

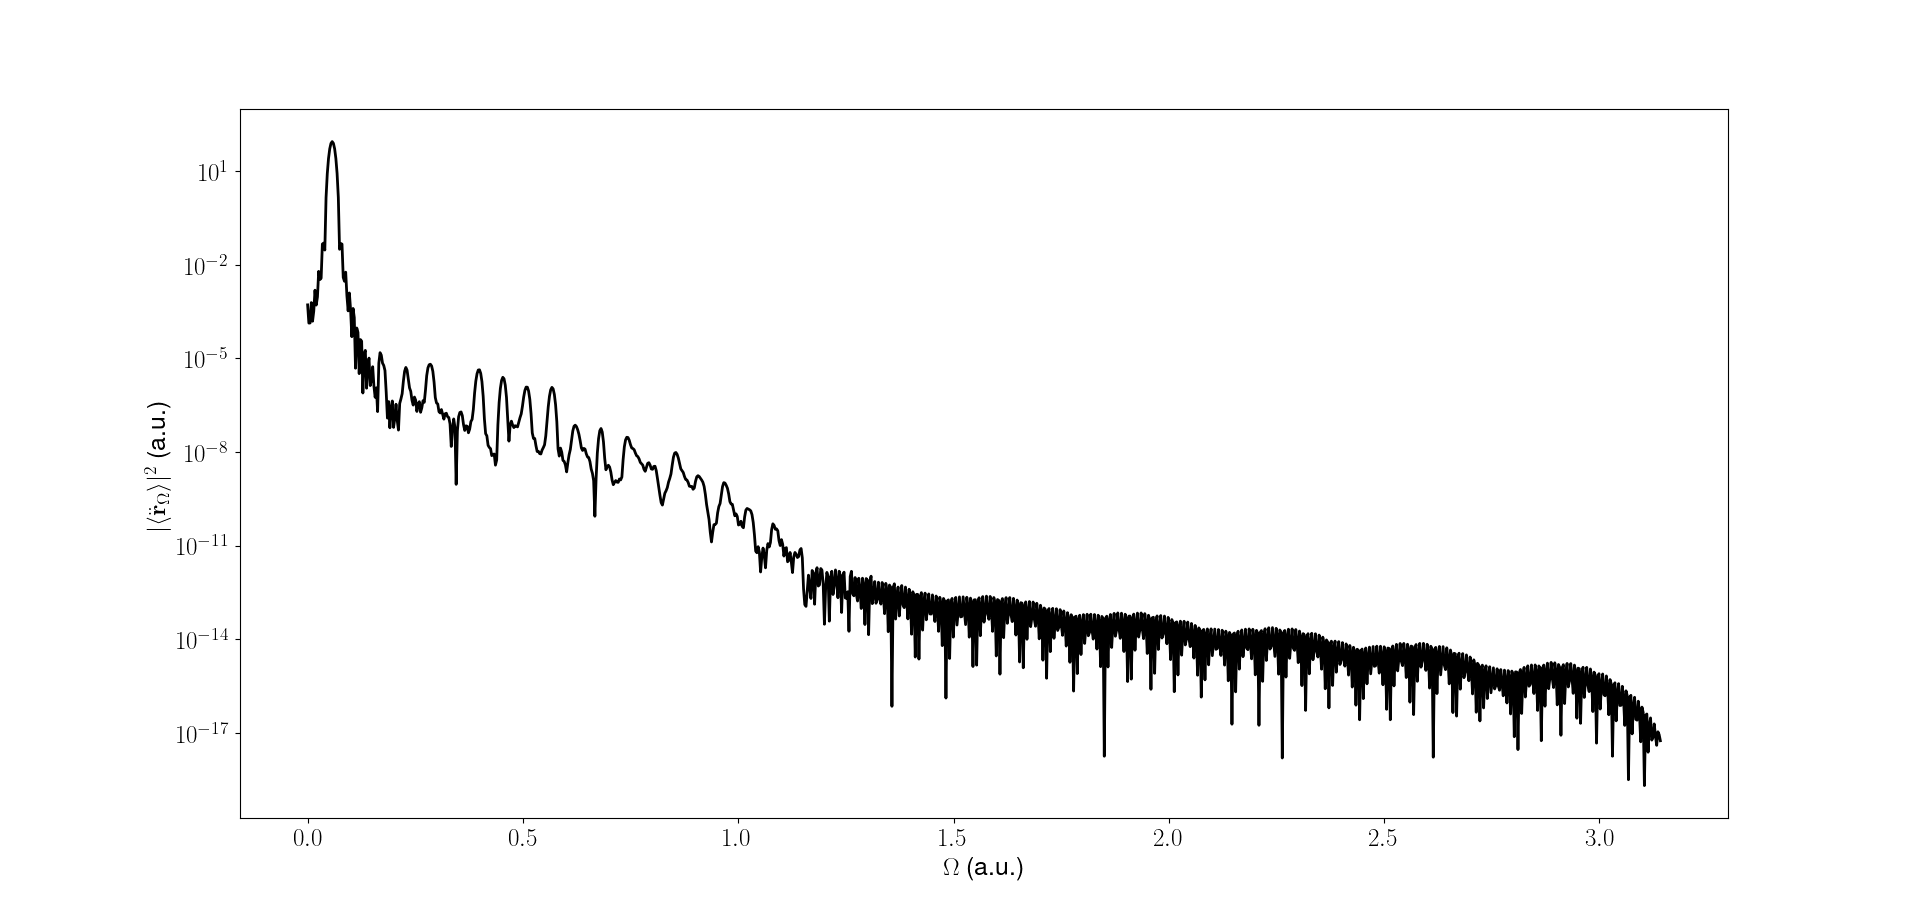
The High Harmonic Generation can be accessed by calculating the expectation value of dipole moment given by \(d(t)=\bra{\psi(t)}x\ket{\psi(t)}\) or the dipole acceleration \(a(t)=\bra{\psi(t)}\ddot{x}\ket{\psi(t)}\) where \(\ket{\psi(t)}\) is the time-dependent wavefunction of the system. The dipole acceleration is related to the dipole moment by \(a(t) = \ddot{d}(t)\). To observe the range of energies emitted during a full laser pulse, we take a fast Fourier transform of the dipole acceleration. The resulting spectrum is called the high harmonic generation \(a(\Omega) = \int a(t) W(t) e^{-\iota \Omega t} dt\), where \(W(t)\) is a window function. The window function is used to avoid the edge effects of the Fourier transform. The window function is usually a Gaussian function or a sine squared envelope.

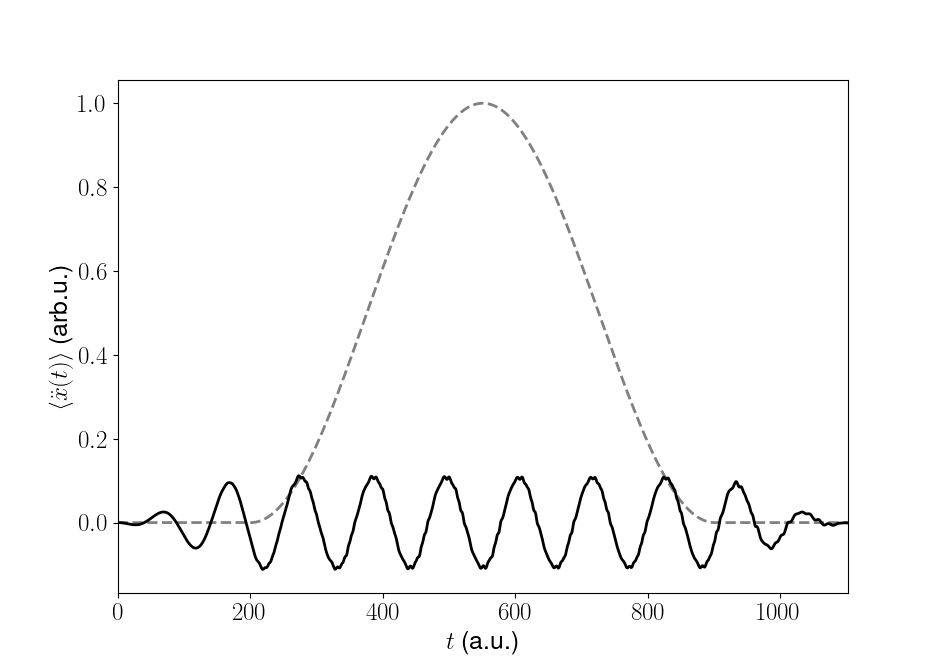
Similarly we can also plot the dipole acceleration as a function of time along with the window function (grey).

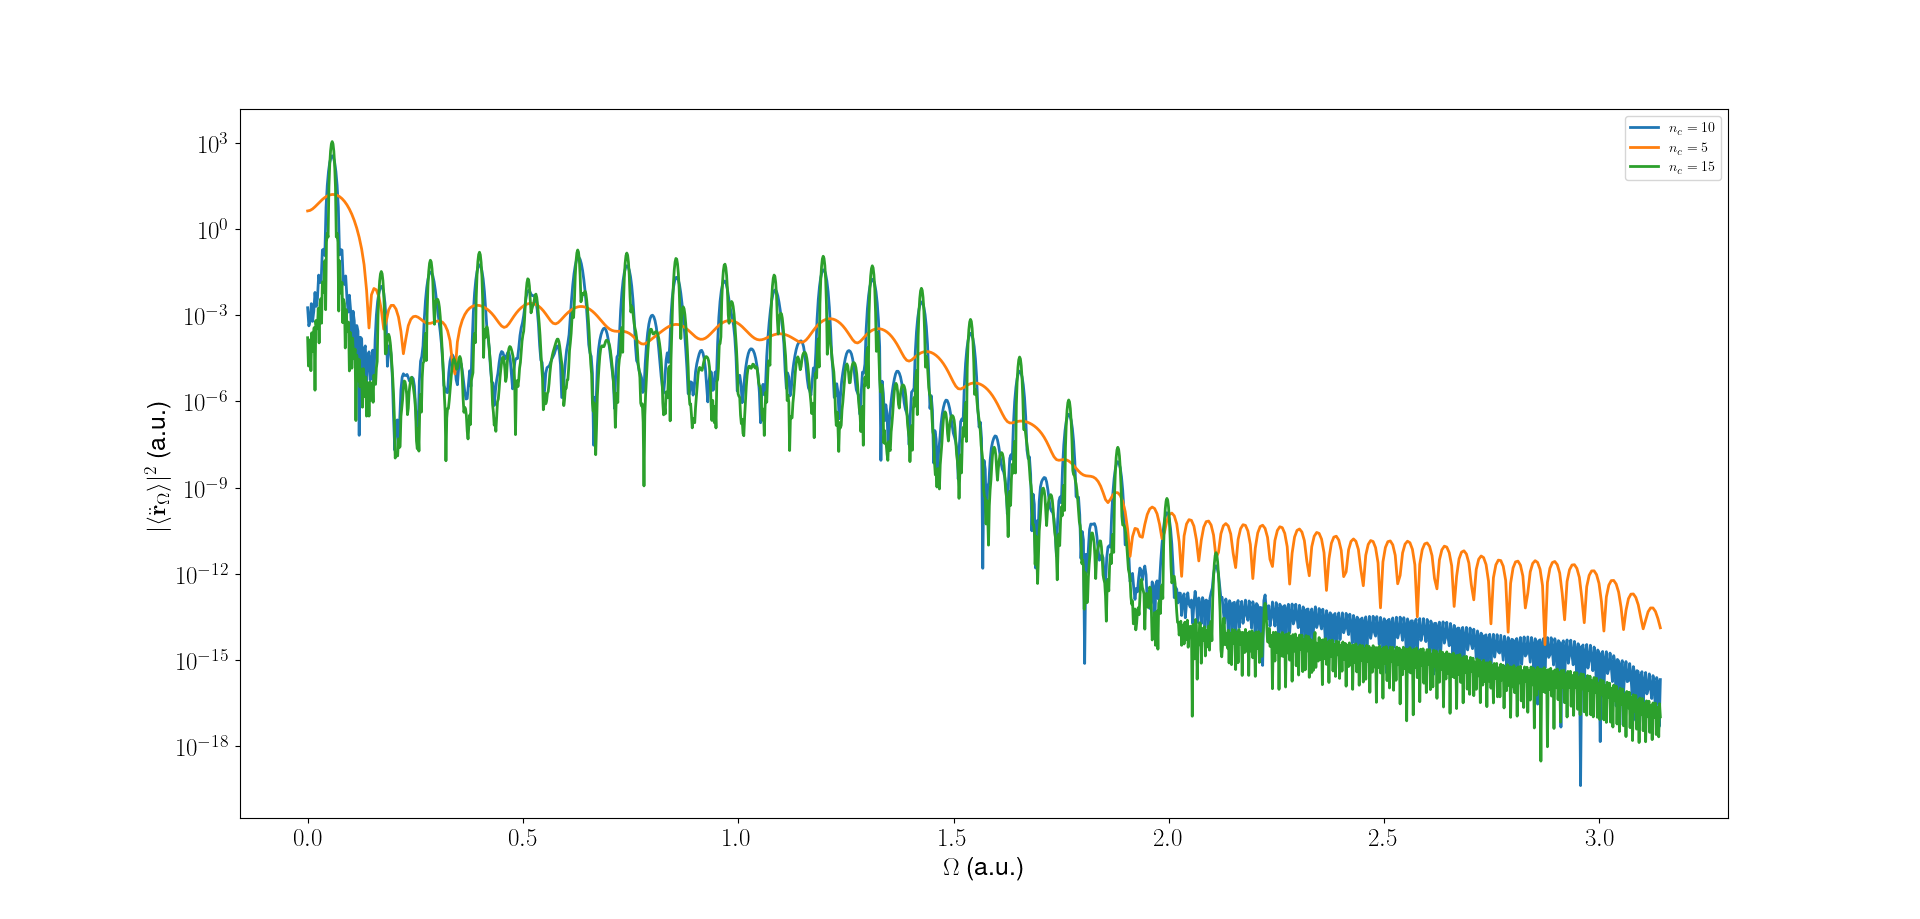
It is interesting to see the effect of various parameters on the HHG output. Here we see, as the number of cycles in the pulse increases, the harmonic cutoff increases. This is because the longer pulse allows for more time for the electron to gain energy from the laser field. Note that plateau structure gets more pronounced as the number of cycles increases. This is because more pulses lead to more interference effects, thus increasing the number of peaks increases in the HHG spectrum. The cutoff energy is given by \(E_{cutoff} = 3.17U_p\) where \(U_p\) is the ponderomotive energy. The ponderomotive energy is given by \(U_p = \frac{e^2E_0^2}{4m\omega^2}\). Both are the same for all the curves in the figure below.
